On December 17, 2024 the State Statistics Committee of Turkmenistan finally published the detailed results of the complete population and housing census of 2022. It includes 11 chapters with graphical images that present census data visually.
While the national media outlets provided active coverage when the population census was completed in 2022 and when preliminary results were published in 2023, they did not provide any media coverage announcing that the detailed and complete census statistics have become publicly available. As of February 6, 2025 the public announcement by the government in the state media has not been made. The state media does not use statistics from the census in its coverage and/or analysis of domestic news and developments.
The detailed results from the 2022 population and housing census reveal valuable data related to fertility, housing, education, health, migration, employment among other topics concerning the life of an average citizen. Such data from the government, that has not been previously available to the public, is a significant progress for Turkmenistan. Some of this data has not been available through other sources either (UN, World Bank, etc), and is completely new, providing fresh context on Turkmenistan.
Among such data is information on child marriage. Previously available only through MICS, limited data on women’s age marriage was based on a sample population while the census data covers the entire population. It provides data on both sexes, giving information for all age ranges, including child marriage. There is also information on disability. It is worth noting that the data is disaggregated by regions, age, sex, and settlements.
However, there are several concerns and limitations with the census results.
Lack of previous census data for meaningful comparison
The website of the State Statistics Committee does not provide any of the previous population census results. Since the country’s independence, at least two censuses have been conducted – in 1995 and 2012 – none of which are available online. This inhibits the ability to review and compare population data overtime, understand demographic dynamics, and spot socioeconomic trends and changes.
Lack of methodology used to collect census data
The State Statistics Committee does not provide the methodology used to produce census 2022 estimates, census response rate, quality of the census statistics including quality control criteria, measurement errors, completeness of enumeration, or the strengths and limitations of the data. This undermines the transparency and reliability of the findings. Without access to the methodology, it is challenging to understand the reasoning and methods behind certain calculations, as well as verify, analyze and interpret data. There is an introduction chapter stating ‘the necessary methodological manuals for the preparation and conducting of the census have been prepared’ but the methodology itself was not shared as part of the census results.
Donate to support Turkmen analysts, researchers and writers to produce factual, constructive and progressive content in their efforts to educate the public of Turkmenistan.
SUPPORT OUR WORKThere is also a 2-page brief that provides definitions of specific statistical indicators and terms. However, it is not comprehensive and does not cover all indicators. Readers have to make assumptions on what specific terms might mean. For example, the data on sources of livelihood lists several terms that are not self-explanatory. Such as the difference between ‘income from the sale of personal subsidiary farm products’ vs ‘natural receipts from personal subsidiary farm (for own consumption)’ or the difference between ‘government allowance’ and ‘disability allowance’ or what is meant by ‘dependent’ for source of livelihood.
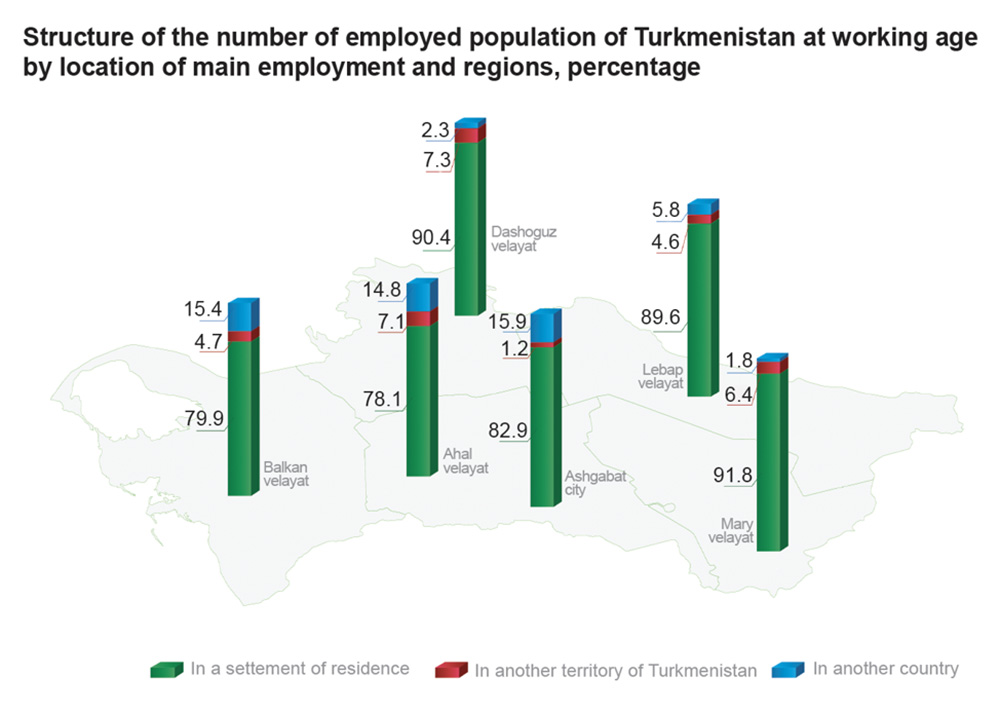
Moreover, some of the statistics raise concerns about validity and reliability of the data, especially ones on immigration. To illustrate, the following figure representing the structure of the employed population shows the number of employed people in another country to be very small, particularly for Mary, Dashoguz and Lebap regions which have a lot of their residence as labor migrants abroad. The census data states that in total 176,320 of Turkmen citizens of working age (18-61 years of age) are currently working in other countries, mainly in Turkey – 166,277 people and Russia – 6,030 people. However, alternative and independent media outlets have reported that since 2012 at least 2 million Turkmen citizens have emigrated abroad.
Misleading visuals make it difficult to understand and interpret data
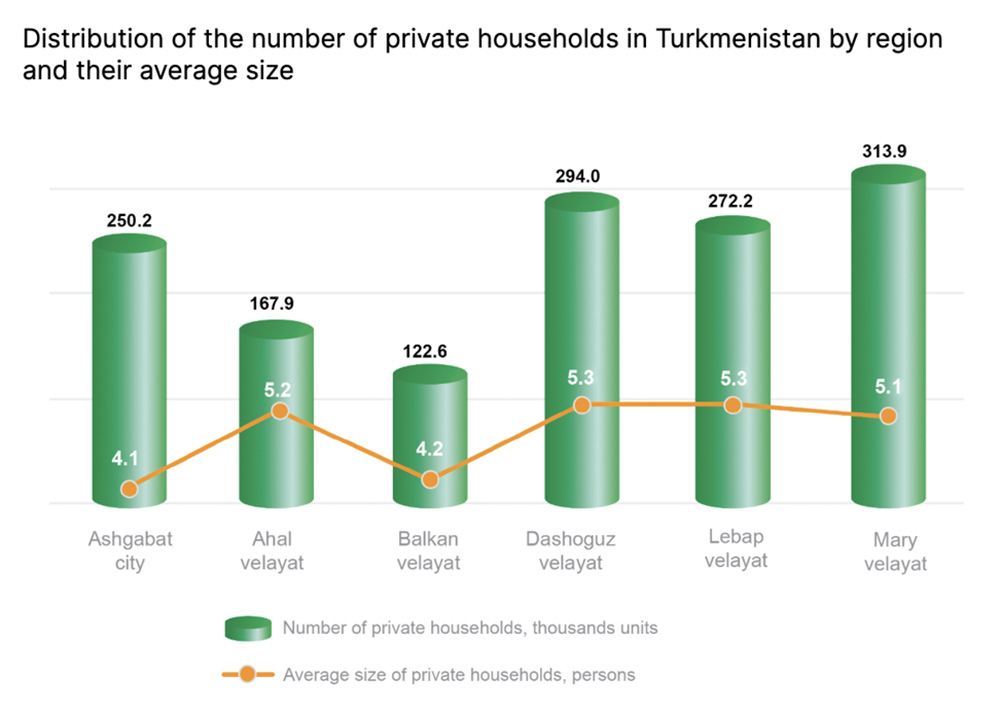
The graphs presented on the website as well as in the pdf documents are somewhat misleading. They have unclear or incorrectly presented scaling, making it difficult to compare different data points. Most graphs lack a clear Y-axis and incorrectly present scales. For example, in the following graph illustrating distribution of private households by region and average size, proportions are all incorrect. While it does not have Y-axis for reference, disproportions are clear when values are compared to each other. The line chart indicates values between 4.1 and 5.3, yet the line on values 4.1 for Ashgabat city is significantly lower and closer to the zero, while 5.3 for Dashoguz and Lebap regions are significantly higher, despite the fact that the difference between the two points is only 1.2 digits.
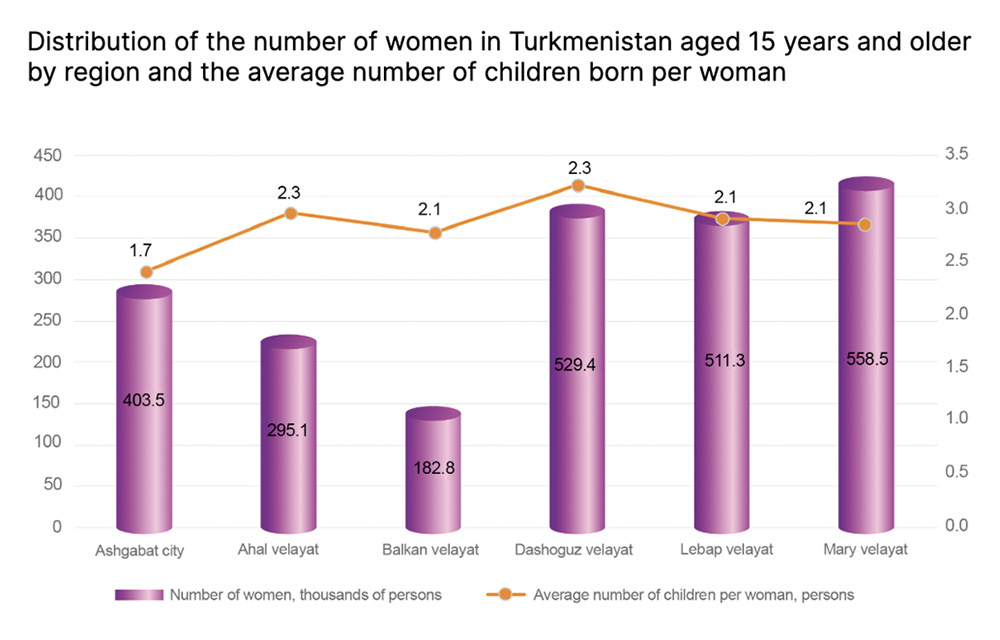
The following chart shows the distribution of the number of women and the average number of children per woman. The maximum scale on the Y-axis is 450 while the largest number of women is 558.5 for Mary region, which should be off the chart. The numbers in the bars do not correspond to the scale on the Y-axis. The same is true with the line chart, as the values do not match the right-side Y-axis either.
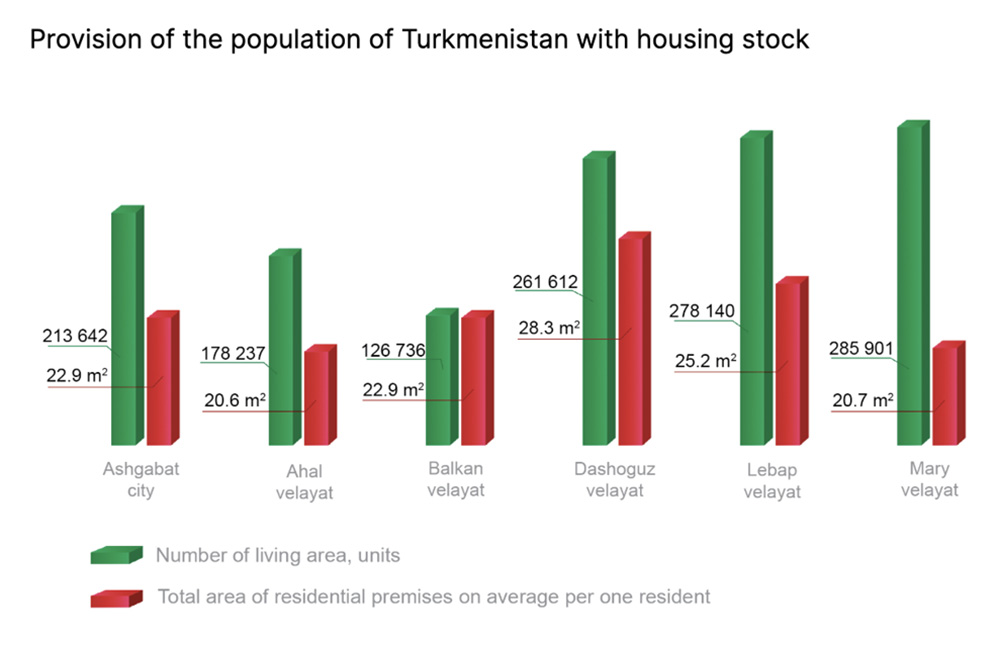
The following figure presents data in bar charts for two completely different values – (1) number of living area in units and (2) total area of residential premises in square meters. Given that they are two different units, they require two different scales. It would have been better to separate the data into two separate charts or instead of having bars for both values, a line chart could have been used for one of the values.
Overall, having access to detailed and disaggregated data from the Turkmenistan 2022 population and housing census will be extremely useful for policy makers, researchers, NGOs and the public at large. However, readers will have to be careful when using and sharing the graphs given their inaccurate representation of the data. It might be better to use the raw data shared in tables and to create respective charts independently to control for quality.